| University | Singapore University of Social Science (SUSS) |
| Subject | MTH220e: Statistics Methods and Inference |
Question 1
In a study to evaluate drug efficacy, the manufacturer of a new type of generic drug for treating a disease wants to investigate the effectiveness of this generic drug as compared to the traditional brand name drug, At the present time, the brand name drug is the only approved treatment for the disease. Patients diagnosed with the disease have a low concentration of a specific factor in their blood. Treatment with the brand name drug will result in an increase in the concentration of the specific factor in the blood. An experiment is conducted in which 10 patients currently with the disease are randomly assigned to receive either the generic drug or the brand name drug for a period of 9 months. After 9 months have elapsed, a measure of the concentration level of the specific factor in the blood is obtained for each patient. The results are shown in Table Q1.
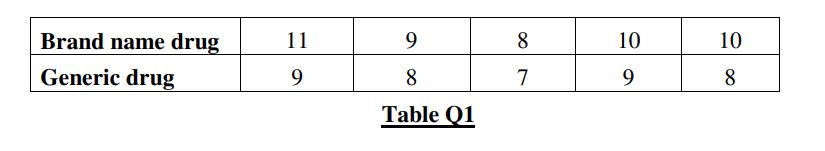
(a) At a 5 % level of significance, apply a two-sample t-test to determine whether there is any difference in the concentration levels between brand name drug and generic drug. Comment on the results.
(b) Construct a 90 % confidence interval for the difference in the mean concentration levels between brand name drug and generic drug.
(c) Suppose now the manufacturer wishes to demonstrate whether the concentration level of brand name drug exceeds that of the generic drug by more than 1, apply a two-sample t-test to analyze the problem based on a 1 % level of significance.
(d) For part (i) above, use R to perform the two-sample t-test. Show the screenshots of the R commands and output results.
Question 2
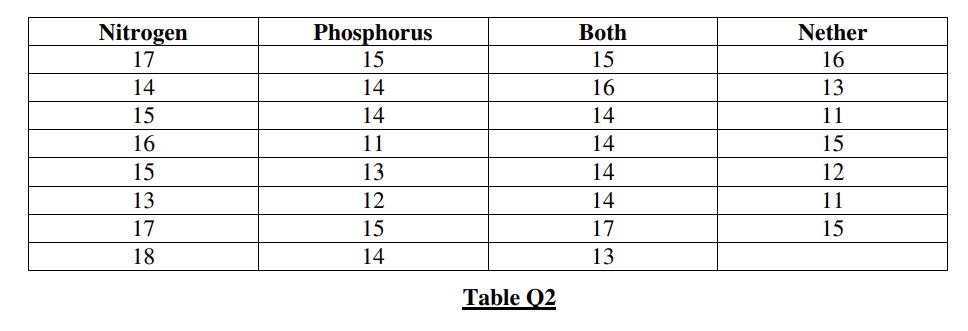
Bromeliads are tropical flowering plants attach to trees and obtain nutrients and moisture from air and rain. Their leaf bases form cups that collect water. An experiment was conducted to study changes in the nutrient cycle and the effects of adding nitrogen, phosphorous, or both, or neither to the cups. The experimental data is shown in Table Q2. Without using R or MS excel, develop a one-way ANOVA using the decomposition of the Sum of Squares method to determine whether there is any difference in the four treatment groups on the growth of bromeliads. You are required to show details of the workings clearly. Explain the F statistic and draw appropriate conclusions at a 5% level of significance. Comment on the results.
Hire a Professional Essay & Assignment Writer for completing your Academic Assessments
Native Singapore Writers Team
- 100% Plagiarism-Free Essay
- Highest Satisfaction Rate
- Free Revision
- On-Time Delivery
Hire a Professional Essay & Assignment Writer for completing your Academic Assessments
Native Singapore Writers Team
- 100% Plagiarism-Free Essay
- Highest Satisfaction Rate
- Free Revision
- On-Time Delivery
Question 3
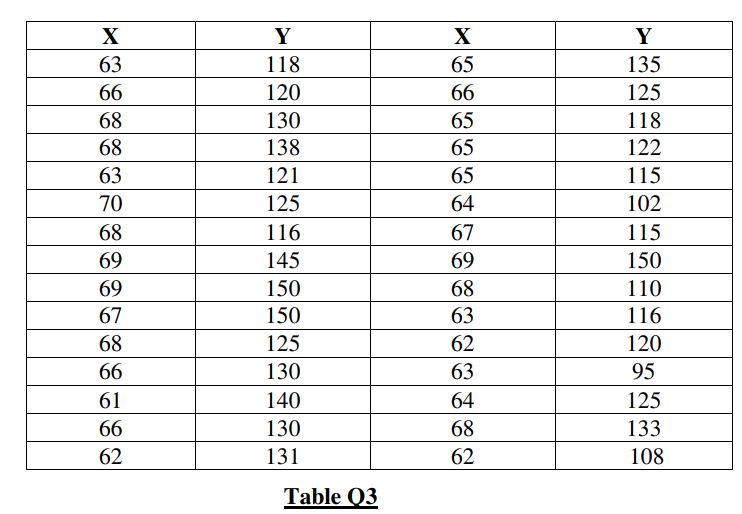
Consider a random sample of 30 data sets (x, y) shown in Table Q3. Given that Y is the dependaent variable.
(a) Sketch and describe the scatterplot of the data.
(b) Determine the Pearson correlation coefficient. Comment on the results.
(c) Determine the equation of the least-squares linear regression line.
Question 4
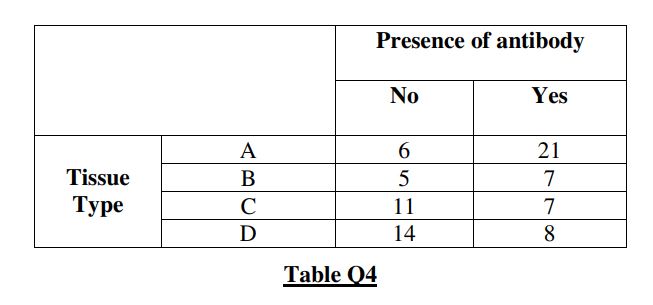
An experimental study is carried out to investigate the presence of an antibody in patients of four different tissue types. The observed pattern of frequencies is shown in Table Q4. The researcher wishes to examine whether there is an association between tissue type and the presence of the antibody.
(a) Describe the null and alternative hypotheses.
(b) Compute the expected frequencies.
(c) At α = 1 %, apply a chi-square test of independence to determine whether there is an association between tissue type and the presence of an antibody.
Question 5
(a) Consider a random sample of the following data: 254, 261, 250, 258, 253, 257. Calculate the unbiased estimator of the population variance.
(b) Suppose the GPA of all students enrolled in a particular course can be modeled by a certain distribution with a mean of 3.4 and variance 0.3. Compute the probability that the mean GPA of a random sample of 40 students selected from this course will be:
(i) lower than 3.2
(ii) between 3.3 and 3.6
(c) Suppose you throw a die 600 times. Apply a suitable technique to compute the approximate probability of obtaining between 90 and 110 fours.
Get instant help with statistics assignment problem from assignment writing specialist of Singapore Assignment Help who has 10+ years of experience of writing thee different assignments of MTH220e: Statistics Methods and Inference for SUSS scholars.

Looking for Plagiarism free Answers for your college/ university Assignments.
- 7WB52012 Career Research Assignment: Post-MBA Executive Role Analysis and Self-Development Planning
- ACFI3004 Australian Tax Residency & Income Assessment: Heny & Joceline Case Analysis
- CSIT213 Java OOP Assignment 1: ECommerce Management System Implementation Without Collections
- A2369C cGMP Compliance Assignment: Internal Audit CAPA Report for Quality Issues in Pharmaceutical Manufacturing
- E2419C Health Products Logistics Assignment: Cold Chain & DG Pharma Handling Case Study for Regulatory Compliance in Singapore
- AVET104 Journey Through the Cell Assignment: A Molecular Adventure into Life’s Inner Workings
- Workplace Risk-Based Assessment 1: Evaluation of Hazards, Accidents, and Safety Compliance
- SRM Reflective Assignment 2: Applying Gibbs Model to Overcome Workplace Report Challenges
- ACLP M1P TAE Written Assignment: Skills Framework & Lesson Plan Design Using Gagne’s and Kolb’s Models
- EGH222 Healthcare Analytics Assignment 2: Predictive Model for Sick Days Based on Employee Demographics and Lifestyle Data