| University | University of Essex (UOE) |
| Subject | BE313: Portfolio Analysis |
Assignment Details:
a. Download the most recent 5 years of monthly closing prices for any two different companies, the stock market benchmark index, and the government securities.
You can use any database to obtain the prices e.g. object, yahoo finance (click the Investing tab followed by the Historical Prices tab), etc. Use the downloaded data to generate average monthly returns. Calculate the annualized average return, the standard deviation of the returns, correlation, and beta of the chosen stocks. You may wish to use excel to perform these calculations. Show your workings clearly.
b. Use investment proportions for the two stocks with intervals of 10%, tabulate the investment opportunity set of the two stocks. Plot the investment opportunity set of the two stocks.
Buy Custom Answer of This Assessment & Raise Your Grades
c. Calculate the investment proportions on the optimal risky portfolio consisting of the two stocks, which we denote by stock 1 and stock 2, using the following formulae:
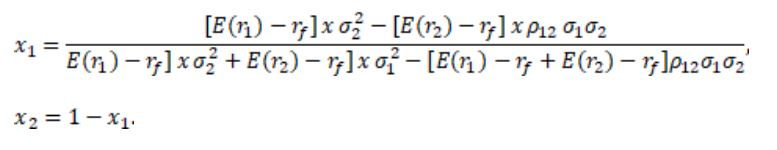
Use the proportions, calculate the expected return and standard deviation of this optimal risky portfolio. Identify the optimal risky portfolio on the diagram for the opportunity set of portfolios.
Discuss in your report diversification referring to the efficient frontier and the expected return and standard deviation of the optimal risky portfolio in your answer.
d. Using the beta obtained in (a), calculate the returns on each stock using the CAPM equation. Discuss whether you think that beta is the adequate risk measure to use for the CAPM?
Compare the expected return using CAPM equation and the expected return found in (a) by subtracting the CAPM predicted return from the historical average return of the stock. This is the amount by which the stock outperformed (+) or underperformed (-) the required return as predicted by CAPM over the historical time period. This is known at the stocks “alpha.”
Graph the Security Market Line (relationship between beta and the expected return) using the risk-free rate from the government securities and the risk premium. On this graph, also graph the average monthly return (from part 1) and beta (from part 2) for each of the three stocks. The distance that the stock lies above the Security Market Line is also the stocks “alpha.”
According to the stocks’ alphas, which stocks outperformed or underperformed historically? Explain why each stock either outperformed or underperformed? Were there special circumstances for any of the companies? Do you think the historical performance will continue? Do you think any of the companies face special circumstances now that will enable them to outperform in the future? Are there any special circumstances that would cause them to under-perform?
Do you often struggle with the Portfolio Analysis assignments? Are you looking for a portfolio analysis assignment help in Singapore? Have you already searched a lot but couldn't find the expert online assignment helper? Don’t be upset. You are now in the right place. We, at Singapore Assignment Help, provide the ultimate solution for investment and portfolio management assignments to Essex university scholars at an affordable price.

Looking for Plagiarism free Answers for your college/ university Assignments.
- MNGT3012 Business Strategy Assignment Brief 2026 | The University of Newcastle
- MGT577 AI Concepts and Applications for Business Leaders End-of-Course Assessment 2026
- MGT564 Managing Digital Transformation in Operations End-of-Course Assessment 2026
- Organic Chemistry Homework Question 2026 | Nanyang Technological University
- BUS105 Statistics Assignment Tutor-Marked Assignment Questions 2026 | SUSS
- MKTG3000 Strategic Marketing Management Assessment Brief 2026 | UON
- AVET204 Animal Nutrition, Care & Behaviour Assignment Brief 2026 | TP
- NUR3506 Translation of Evidence into Practice Assessment 3, 2026 | NUS
- NUR3507 Clinical Practice Development Project Assignment Brief 2026 | NUS
- EGE202 Application Programming Assessment Project 2 2026 | Nanyang Polytechnic