
OMGT1053 Assignment 3 : Individual Quantitative and Qualitative Case Study
Assessment Taks Instructions:
- This assessment evaluates your understanding of key quantitative techniques and problem-solving skills developed during the course. It is worth 40 marks and consists of two tasks (Task 1 and Task 2), each carrying 20 marks.
Submission Requirements:
You are required to submit:
- An Excel workbook: This should include multiple worksheets demonstrating your models, regression analysis summary, model performance comparison, decision tree, and All tabs must be clearly labelled. All calculations must be shown in the workbook and should not appear in the Word report. The Excel workbook and Word report are mutually exclusive components.
- A Word report: This should focus on the economic order quantity (EOQ) analysis and responses to qualitative Avoid duplicating content from the Excel workbook. While there is no specific format, a proper report cover is expected, and each question’s response should start on a new page.
Excel Workbook Guidelines
- Task 1: Demand Forecasting
The Excel workbook for Task 1 should contain four worksheets:
- Moving Average Forecasting Method
- Static Forecasting Method
- Regression Analysis Summary
- Performance Comparison Table
For the performance comparison table, use the format provided in Task 1 Question (c) to compare the two forecasting methods. Also, answer Task 1 Question (d) in this worksheet.
- Task 2: Decision Analysis
The Excel workbook for Task 2 should contain four worksheets:
- Decision Tree and NPV Calculations for the Onshore Option
- Decision Tree and NPV Calculations for the Offshore Option
- Decision Tree and NPV Calculations for the Hybrid Option
- Comparison Table
In all the three worksheets, show the decision tree of the respective sourcing option over the next two periods with all the parameters and outcomes.
For the comparison table, use the format provided in Task 2 Question (d).
Word Report Guidelines
- Task 1:
- Question (e): Include EOQ and total cost calculations of all volume discount options with all steps clearly shown.
- Question (f): Provide in-depth research and analysis supported by recent references (published within the last three to five years).
- Task 2:
- Question (e): Provide in-depth research and analysis supported by recent references (published within the last three to five years).
Important Notes:
- Ensure all Excel tabs are labelled clearly to enhance readability and
- For the Word report:
- Draw neat and easy-to-understand diagrams as
- Focus on clear, concise, yet comprehensive
- Avoid brevity that impacts analysis depth or excessive detail that reduces clarity.
- Marks will be awarded based on:
- Full completion of the required
- Accuracy of
- Clarity and detail in the forecasting models, decision tree, and
- The depth and comprehensiveness of the qualitative
By following these guidelines, you will be able to complete the assignment and effectively demonstrate your understanding of the course material and analytical skills.
Task 1: Demand Forecasting for Mini Portable Air Purifier and Procurement Planning for BIG W in Australia
Description
Demand for Xiaomi Mi Smart Air Purifier 4 Compact at BIG W in Australia for the last 18 months are as follows:
Year Quarter Demand
| 2024 | May | 164 |
| Jun | 297 | |
| Jul | 482 | |
| Aug | 608 | |
| Sep | 221 | |
| Oct | 372 | |
| Nov | 593 | |
| Dec | 789 | |
| 2025 | Jan | 270 |
| Feb | 460 | |
| Mar | 726 | |
| Apr | 984 | |
| May | 342 | |
| Jun | 560 | |
| Jul | 891 | |
| Aug | 1156 | |
| Sep | 402 |
Oct 638
Task Questions to be done in Excel:
a) Estimate the demand for November and December of 2025 using a 3-month moving average method.
(1 mark)
b) Estimate the demand for November and December of 2025 using the static method.
(3 marks)
c) Evaluate the MAD, MAPE and TS (e., the KPIs) in each case and compare them in the format as shown below.
(2 marks)
|
Forecasting Method |
MAD |
MAPE(%) |
TS Range | |
| Min. | Max. | |||
| Moving average method | ||||
| Static method | ||||
| Which method do you prefer? Why? | ||||
d) Based on the findings from (b), which of the two methods do you prefer? Why?
(1 mark)
(Note: You can give your answer in the table of Question (c).)
Task Question to be done in Word:
e) BIG W sells Xiaomi Mi Smart Air Purifier 4 Compact at all its stores across Over the past six months, the average monthly demand for this product has been 600 units. Each time BIG W places an order with Xiaomi Mi Smart Air Purifier 4 Compact, it incurs a fixed cost of $2,000, which covers order placement, transportation, and receiving. Additionally, there is a holding cost equal to 5% of the product’s unit cost.
The standard wholesale price for the product is $70 per unit. To encourage bulk purchases and boost sales, Xiaomi has recently introduced an all-unit quantity discount for its retailers. The pricing schedule is outlined below:
Order Quantity Per Lot Price Per Unit
1 – 3,000
3,001 – 5,000
$70
$69
Over 5,000 $68
1) What is the economic order quantity (EOQ) of the product per lot for BIG W if there is no volume discount?
(1 mark)
2) What is the total annual cost for BIG W assuming there is no volume discount from Xiaomi and the price per unit is $70?
(1 mark)
3) What is the optimal order quantity if BIG W decides to take the volume discount? You need to show the calculations of EOQs and total costs at all the three prices.
(3 marks)
4) What is the new total annual cost for BIG W upon taking the volume discount?
(1 marks)
5) What is the annual saving for BIG W upon taking the quantity discount in comparison with the normal situation when there is no volume discount?
(1 mark)
Conduct research to explore how household electronic appliance retailers, such as BIG W, forecast demand for their products. Demand for many household electronic appliances can be seasonal and vary in popularity based on customer preferences and product characteristics. Formulate a supply chain strategy for the projected air purifier (including portable ones) demand figures as shown in the chart below:
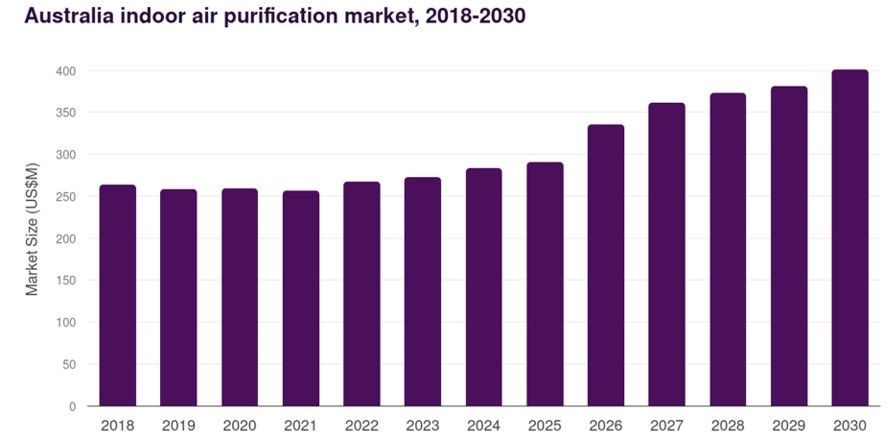
- The Australia indoor air purification market generated a revenue of USD 283.9 million in 2024 and is expected to reach USD 400.8 million by 2030.
- The Australia market is expected to grow at a CAGR of 6% from 2025 to 2030.
- In terms of segment, dust collectors & vacuums was the largest revenue generating product in
- Dust collectors & vacuums is the most lucrative product segment registering the fastest growth during the forecast
Source: Grand View Horizon (https://www.grandviewresearch.com)
The supply chain strategy should involve both supply and demand considerations as well as inventory management and distribution arrangement. Use a flow chart to summarise with adequate details the strategy formulation process. You need to draw the flow chart in the Word document using shapes and textboxes.
(3 marks)
DO NOT simply attach a picture generated using AI or other drawing tools. No marks will be given if the flow chart is provided as a picture.
To show your thinking process, write a reflective report or journal detailing in text the steps you have taken to come up with the idea as shown in the flow chart and the research process such as sourcing of data and information. You should also reflect what you have learned in the process and how it applies to future business challenges.
(3 marks)
DO NOT use AI to generate a report. No marks will be given if an image is provided instead of a text-based reflective report or journal.
a) Important Note: An essay is NOT required for this Instead, you need to create a well-structured flow chart in the Word document, supported by detailed text boxes that explain your ideas. Submissions presented exclusively in essay format or a
picture will not be accepted. You are expected to conduct your own research and clearly demonstrate the process by which you arrived at your conclusions through the reflective report or journal. Sources of information and references used must be clearly stated. DO NOT rely solely on ChatGPT or any other AI model to complete the work. AI-generated content is easily identifiable, and such submissions will receive minimal or no marks, as they do not reflect your own effort.
Task 2: Sourcing Decision for BIG W
Description
BIG W is an Australian chain of discount department stores, which was founded in regional New South Wales in 1964. The company is a division of the Woolworths Group and as of 2024 operated 179 stores, with around 18,000 employees.
In recent months, BIG W has experienced growing sales of mini portable air purifiers, because of increasing public concern about air quality. However, as with many seasonal products, changing weather and shifting consumer preferences make demand difficult to predict. To date, the company has sourced a significant portion of its products from China, benefiting from lower production costs. For a popular mini portable air purifier, the total sourcing cost, inclusive of production and delivery, is 350 Chinese yuan (RMB) per unit. At the current exchange rate of 5 RMB per AUD (1 AUD = 5 RMB), this translates to approximately 70 AUD per unit.
A key challenge with the Chinese supplier is its long lead time, requiring BIG W to finalise order quantities well before the product is marketed. This lack of flexibility can result in lost sales if demand exceeds the order size or excess inventory if demand falls short.
As an alternative, BIG W could source an equally popular model from a local supplier. While the cost is higher at 80 AUD per unit, the local supplier offers the advantage of rapid delivery, allowing BIG W to closely align supply with actual demand. This flexibility is particularly appealing for new products with uncertain demand. The company now faces the challenge of assessing the value of this responsiveness relative to the higher variable cost of the local supplier.
Uncertainties Faced by BIG W
To evaluate the two suppliers, BIG W has identified demand and exchange rates as the two primary uncertainties affecting its operations. Based on current estimates, annual demand for the product is expected to be 7,000 units. However, over the next two years (or periods), demand could fluctuate: there is a 50% probability it will increase by 10% and a 50% probability it will decrease by 10%.
Similarly, the exchange rate for the Chinese Renminbi (RMB) also presents uncertainty. Over the same two periods, the RMB may either strengthen by 5% or weaken by 5%, each with a probability of 0.5. At present, the exchange rate stands at 5 RMB per AUD.
These factors—demand variability and currency fluctuations—will play a crucial role in comparing the cost-effectiveness and reliability of the two suppliers.
Ordering Policies with the Two Suppliers
Due to the long lead time of the offshore supplier, BIG W must place orders well before it can accurately predict demand for the period. Given the uncertainty in demand over the next two periods and the attractive profit margin of 40 AUD per unit (at a sale price of 110 AUD), management has decided to order a quantity slightly above the expected demand to minimise the risk of lost sales. However, any unsold units at the end of the period would incur a significant disposal cost, as they cannot be resold or generate any scrap value.
With an expected annual demand of 7,000 units, BIG W has chosen to order 7,500 units from the Chinese supplier for each of the next two periods. If demand in a given period exceeds 7,500 units, BIG W can sell up to the ordered quantity. Conversely, if demand falls below 7,500 units, the surplus inventory will have to be donated, for example, to World Vision Australia, Australian Red Cross, and Salvation Army, without generating any revenue.
In contrast, the local supplier’s short lead time offers greater flexibility. BIG W can order smaller quantities incrementally based on actual sales, ensuring that demand is fully met without accumulating excess inventory. This approach allows the final order from the local supplier to precisely match the demand for each period, eliminating both unsold inventory and lost sales.
A Potential Hybrid Strategy
The local supplier has proposed an alternative arrangement that allows BIG W to utilise both suppliers, each fulfilling distinct roles. According to this proposal, the Chinese supplier would handle the production of a predetermined base quantity per period, ensuring the entire batch is sold to avoid any excess inventory. The local supplier, with its shorter lead time, would step in to address any demand shortfalls by supplying a comparable product with similar functionality and quality, ensuring no sales are lost if demand exceeds expectations.
Based on current estimates, selling 6,500 units annually is highly feasible. Under this arrangement, BIG W would commit to a baseline order of 6,500 units from the Chinese supplier each period. If demand matches or falls below this threshold, no additional orders would be needed from the local supplier. However, if demand exceeds 6,500 units, say, reaching 7,000 units, the local supplier will promptly fulfill the 500-unit shortfall, ensuring seamless responsiveness and preserving customer satisfaction.
While this hybrid strategy ensures flexibility and responsiveness, the local supplier’s role would be limited to addressing a small fraction of the total demand. To account for this reduced volume and enhanced flexibility, the local supplier proposes a unit price of AUD 85 under the hybrid arrangement.
Task Questions to be done in Excel
a) Draw a decision tree for each option reflecting the uncertainties over the next two periods. Identify each node in terms of demand and variable cost (may be affected by the fluctuations in exchange rate) and the transition probabilities. Use two decimal points in your notation of variable cost, if needed.
(6 marks)
b) If BIG W is to pick only one of the two suppliers, which one would you recommend? What is the NPV of the expected profit over the next two periods for each of the two choices? Assume an interest rate of k = 0.1 per period.
(4 marks)
c) What do you think about the hybrid approach? Is it worth paying the local supplier extra to use it as part of a hybrid strategy? For the hybrid approach, assume that BIG W will order a base load of 6,500 units from the Chinese supplier for each of the two periods, making up any shortfall in each period at the local supplier. Evaluate the NPV of the expected profits for the hybrid option assuming an interest rate of k = 0.1 per period.
(2 marks)
d) Create a comparison sheet using the following format. Based on the findings from (b) and (c), which option should BIG W pursue? Why?
(2 mark)
| Option | NPV of Total Expected Profit |
| Sourcing from the local supplier | |
| Staying from the Chinese supplier | |
| Hybrid sourcing | |
| Which sourcing option would you recommend? Why? |
NOTE: In this scenario, Period 0 represents the current year, during which BIG W sources exclusively from the Chinese supplier. The three options being evaluated pertain to the subsequent two years, referred to as Periods 1 and 2. Consequently, the profit or loss from Period 0 can be excluded from the total NPV calculations for each option. This is because the profit or loss in Period 0 remains constant across all three options and, therefore, does not influence the comparison.
Even if the Period 0 profit or loss were included, it would have no impact on the relative outcomes. However, it is essential to determine the profit or loss for Periods 1 and 2 under each option, discount these values back to Period 0, and calculate the respective NPVs. These discounted values will form the basis for comparing the three options effectively.
Task Question to be done in Word
e) Imagine yourself being a supply chain analyst for discount department stores such as BIG W in Conduct your own research to identify a recent supply chain issue faced by the industry. Use a decision tree to analyse different risk mitigation strategies. Again, instead of writing an essay, create a decision tree in the Word document using shapes and textboxes showing all the necessary details (use some real data as parameters of the decision tree through our own research) that enable you to recommend the best risk mitigation option.
(3 marks)
DO NOT simply attach a picture generated using AI or other drawing tools. No marks will be given if the decision tree is provided as a picture.
To show your thinking process, write a reflective report or journal to show how you approached the research, what sources you consulted and why, what challenges you faced in applying the decision tree, and what insights gained about the methodology.
(3 marks)
DO NOT use AI to generate a report. No marks will be given if an image is provided instead of a text-based reflective report or journal.
Important Note: An essay is NOT required for this task. Instead, you need to create a well-structured decision tree in the Word document, supported by real data that you gathered through you own research to enable the analysis of different risk mitigation strategies. Submissions presented exclusively in essay format or a picture will not be accepted. You are expected to conduct your own research and clearly demonstrate the process by which you arrived at your conclusions through the reflective report or journal. Sources of information and references used must be clearly stated. DO NOT rely solely on ChatGPT or any other AI model to complete the work. AI-generated content is easily identifiable, and such submissions will receive minimal or no marks, as they do not reflect your own effort.
Hire a Professional Essay & Assignment Writer for completing your Academic Assessments
Native Singapore Writers Team
- 100% Plagiarism-Free Essay
- Highest Satisfaction Rate
- Free Revision
- On-Time Delivery