| University | Singapore Institute of Technology (SIT) |
| Subject | CVE2112 Data Analysis |
Project Description
This is an individual project focused on descriptive statistics and data visualization techniques to analyse public housing HDB resale flat prices in Singapore from 2017 to 2025. Students will use real-world data sourced from data.gov.sg (Singapore’s official public data repository).
The objective is to develop proficiency in preparing, processing, analyzing, and visualizing data using RStudio. Students will also be encouraged to use Generative AI (GenAI) tools (such as ChatGPT, Copilot, Gemini) to aid in R programming tasks, including data wrangling and plotting.
Learning Outcome
By completing this continuous assessment (CA), students will be able to:
- Perform data cleaning and transformation on real-world datasets using R.
- Apply descriptive statistics to summarize housing market data.
- Generate meaningful visual representations of data trends and distributions.
- Interpret data analysis results and draw relevant conclusions.
- Utilize GenAI tools to assist in the development of data analysis code and visualizations.
Dataset Overview
The dataset used in this project was downloaded from data.gov.sg, which is Singapore’s official open data repository. The data set contains records of HDB resale flat prices based on the registration date of the transactions, covering the period from January 2017 to April 2025.

Hire a Professional Essay & Assignment Writer for completing your Academic Assessments
Native Singapore Writers Team
- 100% Plagiarism-Free Essay
- Highest Satisfaction Rate
- Free Revision
- On-Time Delivery
The dataset “ResaleHdbFlat2017to2025.csv” is provided in CSV (Comma-Separated Values) format. It can be opened using spreadsheet software such as Microsoft Excel, which allows you to view the tabular structure of the data before importing it into RStudio for analysis. An example of how the dataset appears in Excel is shown below.
The dataset contains 11 columns, each representing a specific attribute of the HDB resale transaction:
- Month – The month and year of the transaction (formatted as YYYY-MM).
- Town – The town or estate where the flat is located.
- Flat type – The classification of the flat based on size and layout (e.g., 3 ROOM, 4 ROOM).
- Block – The block number of the HDB flat.
- Street name – The name of the street where the flat is located.
- Storey range – The floor level range of the unit (e.g., 10 TO 12).
- Floor area (sqm) – The size of the flat in square metres.
- Flat model – The design model of the flat (e.g., New Generation, Model A).
- Lease commence date – The year the 99-year lease started.
- Remaining lease – The number of years left on the lease at the time of resale.
- Resale price – The transaction price in Singapore dollars.

For this project, students are required to analyze only the transactions from the town where they currently reside. This ensures that each student conducts a focused and personalized analysis based on a familiar location.
Students will load the dataset into RStudio, filter it to include only their selected town, and then carry out data cleaning, statistical analysis, and visualization tasks as outlined in the assignment instructions.
SEE ANNEX A FOR THE LIST OF TOWN AND FLAT TYPE
To begin your analysis in RStudio, follow these simple steps to read and filter the dataset with the name of your town.
# Load the necessary libraries
library(tidyverse)

# Read the CSV file into R (ensure the file is in your working directory)
hdb_data <- read_csv("ResaleHdbFlat2017to2025.csv")

# Replace "YOUR TOWN" with the name of your town in CAPITAL LETTERS (e.g., "TAMPINES")
selected_town <- "YOUR TOWN"

# Filter the dataset to include only transactions from your town
town_data <- hdb_data %>%
 filter(town == selected_town)

# View the first few rows of the data
head(town_data)
Tasks
Students are to focus their analysis on only one town—specifically, the town where they currently reside. They are expected to perform the tasks below and submit a structured data analysis report.
Tasks Descriptions
- DATA PREPARATION
- Import and inspect the dataset.
- Convert date fields to proper date/time format.
- Filter the data to include only records from your residential town.
- Handle any missing values or inconsistencies.
- SUMMARY STATISTICSProvide descriptive statistics for resale prices in your town filtered by flat type (i.e., 1 ROOM, 2 ROOM, 3 ROOM, 4 ROOM, 5 ROOM, EXECUTIVE, MULTI-GENERATION)
- Mean, median, minimum, maximum, Q1 and Q3
- Standard deviation, interquartile range (IQR), coefficient of variation (cov)
- Number of transactions per flat type
Tabulate the above summary statistics in the following table format
Town Flat type* Number of transactions Mean Median SD Min Q1 Q3 Max IQR cov “YOUR TOWN” 1 ROOM 2 ROOM 3 ROOM 4 ROOM 5 ROOM EXEC… MULTI… * if applicable
Buy Custom Answer of This Assessment & Raise Your Grades
- DATA VISUALISATIONSCreate the following plots for your town filtered by flat type using ggplot2 package:
- Histogram with KDE (Kernel Density Estimate): Visualize the distribution of resale prices, with a smooth density curve overlay.
- Cumulative Distribution Plot: Show the cumulative proportion of resale prices to understand pricing thresholds
- Time Series Plot: Analyze how the average resale price changes over year.
- Pie Chart: Show the proportion of total transactions by flat type.
- Box-plot with Jittered data points: Compare the spread and central tendency of resale prices across flat types
- Any other plots that you may think useful (e.g. further filtered by remaining lease or storey range)
Ensure all visualizations are clearly labelled and interpreted.
Creativity is encouraged — feel free to enhance your visuals with themes, colors, or annotations to improve clarity.
SEE ANNEX B FOR EXAMPLE OF DATA VISUALISATION PLOTS
Report Submission Requirements
Students must submit a written report in PDF format that includes the following clearly labeled sections. The report should be concise, well-organized, and supported with tables, plots, and commentary. You are encouraged to apply creativity in your presentation and data visualization to effectively communicate your findings.
- IntroductionBriefly introduce the project and your selected townState the objective of the analysis (e.g., to explore resale price trends, flat type distributions, and lease effects in your town)
- Data PreparationDescribe the data cleaning and preprocessing steps you performed.Mention any assumptions made or filters applied (e.g., filtering by town, handling missing values, converting date formats).
- Summary StatisticsPresent summary statistics in tableComment on price levels, variation, and trends
- Data VisualisationsInclude and describe each of the required plotsHighlight key observations
- Observations and InsightsDiscuss any interesting patterns or anomalies you discovered.Provide your interpretation of the data in the context of your town.
Consider factors like flat type, lease duration, and price variation.
- Use of GenAI in learningDescribe how you used Generative AI tools to: Write or debug R code, Understand statistical concepts, Generate visualizationsReflect on how these tools supported your learning
- ConclusionSummarize your key findingsReflect on what you learned about your town’s HDB resale market
Mention any limitations for further data exploration
Guiding questions. Use these to help structure your analysis and reflection:
- What is the most common flat type in your town?
- How have resale prices changed over time?
- How does your town compare to national averages (if known or researched)?
- Are there specific flat models or storey ranges that are more common in your town?
- Does your town show signs of gentrification or aging infrastructure based on lease dates and prices?
- Which flat type has the highest average resale price?
- Are there any outliers or unusual trends in the data?
- How does the remaining lease affect resale prices?
- What challenges did you face during the analysis?
- How did GenAI tools help you in this project?
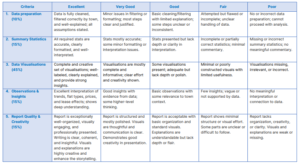
SEE ANNEX C FOR THE ASSESSMENT RUBRIC
Stuck with a lot of homework assignments and feeling stressed ? Take professional academic assistance & Get 100% Plagiarism free papers
Other submission instructions
Please submit the softcopy of your written report in a pdf format together with your RStudio script file (.R) into LMS dropbox by Sunday, 1st June 2025, 23.59hrs.
Plagiarism is strictly prohibited.
- Submitting work that is copied from another student will result in a zero mark.
You are encouraged to discuss ideas and collaborate on learning, but:
- Do not copy code or text from others
- Your submission must reflect your own understanding and work
Use of Generative AI tools (e.g., ChatGPT, Copilot) is allowed, but you must:
- Use them responsibly
- Acknowledge how you used them in your report
ANNEX A – LIST OF TOWN AND FLAT TYPE (based on the csv file provided)
LIST OF TOWN
- ANG MO KIO
- BEDOK
- BISHAN
- BUKIT BATOK
- BUKIT MERAH
- BUKIT PANJANG
- BUKIT TIMAH
- CENTRAL AREA
- CHOA CHU KANG
- CLEMENTI
- GEYLANG
- HOUGANG
- JURONG EAST
- JURONG WEST
- KALLANG/WHAMPOA
- MARINE PARADE
- PASIR RIS
- PUNGGOL
- QUEENSTOWN
- SEMBAWANG
- SENGKANG
- SERANGOON
- TAMPINES
- TOA PAYOH
- WOODLANDS
- YISHUN
LIST OF FLAT TYPE
- 1 ROOM
- 2 ROOM
- 3 ROOM
- 4 ROOM
- 5 ROOM
- EXECUTIVE
- MULTI-GENERATION
ANNEX B – EXAMPLE OF DATA VISULATION PLOTS
The following are example data visualisation plots created using dummy data to illustrate the expected outputs. Students are encouraged to be creative — feel free to enhance your visuals with themes, color palettes, annotations, or layout adjustments to improve clarity and presentation.

ANNEX C – ASSESSMENT RUBRIC
Hire a Professional Essay & Assignment Writer for completing your Academic Assessments
Native Singapore Writers Team
- 100% Plagiarism-Free Essay
- Highest Satisfaction Rate
- Free Revision
- On-Time Delivery
Singapore Assignment Help is an online assignment writing service provider that is reliable, affordable, and capable of writing any subject assignment for you. You can check some of the data analysis assignment samples uploaded on our website and see how our expert report writers write data analysis assignments.

Looking for Plagiarism free Answers for your college/ university Assignments.
- 7WBS2009 Financial Management and Analysis Assignment Brief 2026 | SUSS
- 5010MKT Marketing Management Assignment Brief 2026 | Coventry University
- FILM1000 Introduction to Film Studies Assignment Brief 2026 | NTU
- CET206 Full Stack Web Application Development Tutar Marked Assignment Questions 2026 | SUSS
- 7WBS2011 Strategic Management Research Assignment Brief 2026 | PSB Academy
- HBC101 Understanding Contemporary Society: The Social and Behavioural Sciences TMA 01 2026 | SUSS
- SOC365 Popular Culture End-of-Course Assessment Question 2026 | SUSS
- BME317 Biomedical Devices Innovation Tutor-Marked Assignment 2026 | SUSS
- CU6027 Digital Marketing Report Assessment Brief 2026 | SUSS
- RBP020L062V Financial Performance Management Summative Assessment 2026