Assignment Details:
Question 1
a) Using PSPP/SPSS, analyze the dataset and obtain the descriptive statistics and graphs for the variables:
i) Age in Years,
ii) Gender,
iii) Program of Study, and
iv) Fear of Statistics.
Present the results in one table and four separate graphs following the APA format.
Note: Please cut and paste your PSPP/SPSS output into your answer to demonstrate that you have used PSPP/SPSS.
b) Examine why it is inappropriate for all Singaporeans to be considered as the population of interest for the sample participants in the dataset. Recommend a more appropriate population of interest that the sample participants represent.
Note: You are advised to use the descriptive statistics in Question 1 a and other necessary information about Singaporeans and possible populations of interest to help you examine the appropriateness of different population of interest. For information on the Singaporean population, you can refer to the Singapore Department of Statistics website:
Question 2
It has been proposed that higher levels of social support negatively predict perceived stress.
a) Formulate the appropriate hypotheses and use PSPP/SPSS to analyze the data using the most appropriate statistical test. Interpret the results to determine if the above proposal is supported by the data, and report the findings in APA format.
Note 1: Include all important steps in the analysis and report all necessary descriptive and inferential statistics and results. Also please cut and paste your PSPP/SPSS output into your answer to demonstrate that you have used PSPP/SPSS.
Note 2: Do elaborate on the reasons why you think a particular statistical test is appropriate.
Note 3: For the six-item Social Support scale, the score is calculated by averaging the 6 items for each participant. For more details on the scale, refer to the following article:
https://www.sciencedirect.com/science/article/abs/pii/S089543561400458
Note 4: Refer to the following website for details on how to score the 4-item Perceived Stress Scale:
http://www.psy.cmu.edu/~scohen/PSSscore.html
b) Briefly explain what restricted range and outliers are and how they can affect the results of your analysis. Examine the data to see if restricted range and outliers are present in the dataset.
Note: Do explain how you examine if restricted range or outliers are present and cut and paste any necessary PSPP/SPSS outputs to support your explanation.
Question 3
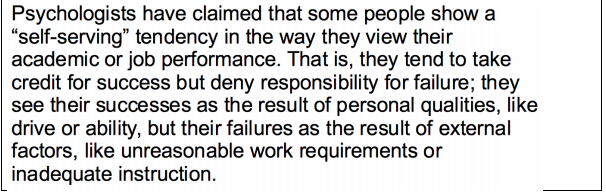
The bias blind spot is an effect that postulates that people see themselves as less susceptible to bias than others. This effect was tested in PSY392 Students in January 2019 and July 2019 using the concept of self-serving bias. Students read the following description of what self-serving bias is about.
a) Formulate the necessary hypotheses and use PSPP/SPSS to analyze the data by applying the most appropriate statistical test. Interpret the results to determine if the bias blind spot is present, and report your results in APA format.
Note 1: Include all important steps in the analysis and report all necessary descriptive and inferential statistics and results. Also please cut and paste your PSPP/SPSS output into your answer to demonstrate that you have used PSPP/SPSS.
Note 2: Do elaborate on the reasons why you think a particular statistical test is appropriate.
Note 3: The dependent variable can be treated as having an interval scale of measurement.
b) Recommend an alternative statistical test that can be used to analyze the data in Question 3a.
Note: Do elaborate on the reasons why you think this particular statistical test is a suitable alternative.
Buy Custom Answer of This Assessment & Raise Your Grades
SingaporeAssignmentHelp.com is the world's best online assignment help company that presents the Singaporean university students with the best statistics assignment help. For any kind of writing assistance, you can contact our team of experts who are accessible 24x7 online.

Looking for Plagiarism free Answers for your college/ university Assignments.
- 7WBS2012 Executive Career Development Assignment: Career Pathway & Readiness Post-MBA in Education Management
- CVE2322 Gantry Build Prototype Assignment: Sustainable Civil Engineering Model Using Recyclable Materials
- BMG706 Strategic Quality Change Assignment Report: Enhancing Operational Excellence at any Organization
- CVE2323 Structural Analysis Assignment: Matrix Method & STAAD.Pro Evaluation of Frame Systems
- BMK3015 Major Project Assignment: Customer-Centric Design Solutions Using Research & Project Management
- Wellbeing Assignment: University Students’ Perspectives for Improving Mental Health Support
- BCLO001 Business Statistics Assignment: Analysis of Exercise Duration Among Singaporean Students
- BM4364 Customer Experience Assignment: Evaluating CX Practices Through Employee Insights in the Service Industry
- GSFM7514 Accounting & Finance Assignment: SAC Services & MEMC Budgeting and CCID Investment Evaluation
- BM0973 BCRM Assignment: Genting Highlands Case Study for Crisis Response and AI-Supported Recommendations