
QTS0109 Individual Assignment 100 marks (30%)
Due date: Jul 24th 2026 (Fri), 11.59 am
Penalty Marks for Late Submission of Assignment
Within 24 hours: 20% to be deducted from total marks
More than 24 hours: submission will be graded zero
Answer ALL questions in Sections A and B
Submit an Excel answer file in Canvas:
(1) Use Section A sheet in the Excel data template provided in Canvas to answer questions from Section A.
(2) Use Section B sheet in the Excel data template provided in Canvas to answer questions from Section B.
Section A (50 marks)
(1) For each variable listed below, state the variable type.
[Qualitative, Quantitative (Discrete) or Quantitative (Continuous)]
| Variable | Variable Type |
| Number of items purchased in a supermarket transaction | |
| Preferred food delivery platform | |
| Time spent on revision for exam | |
| Number of courses taken in a semester |
(8 marks)
(2) For each of the following variables, state the Level of Measurement (Nominal, Ordinal or Ratio).
| Variable | Level of
Measurement |
| Customer satisfaction rating (1= Very Poor to 5= Excellent) | |
| Monthly expenditure on groceries ($) | |
| Type of transport used (Bus, MRT, Taxi, Private Car) | |
| Ranking of service quality (1st, 2nd, 3rd) | |
| Size of apartment (square meters) |
(5 marks)
(3) A retail chain, UrbanMart Pte Ltd, operates multiple outlets across Singapore and maintains a database of 8,000 loyalty programme members. Management intends to sample 200 members to conduct a survey to evaluate customer satisfaction with pricing and product variety.
(a) Describe how a simple random sample may be selected.
(b) Describe how a stratified sample may be selected.
[Use your own words. Do not copy from any sources]
(8 marks)
(4) State and briefly explain whether the statements below refer to descriptive or inferential statistics.
(a) The average monthly sales revenue of a café last quarter was $52,000.
(b) Based on a survey of 150 households, 40% prefer online grocery shopping. The analyst concludes that 40% of all households prefer online grocery shopping.
(c) A survey of 500 employees found that 68% are satisfied with their work-life balance.
(9 marks)
(5) A company is conducting a customer satisfaction survey to evaluate its products and services. Instead of selecting respondents randomly, the company only selects its VIP members to be included in the final dataset. Identify the main type of research bias that is likely to occur in this situation and explain clearly why this type of bias arises.
(4 marks)
(6) For each of the following situations stated below identify which refers to a population and which refers to a sample.
(a) A survey is conducted on 400 randomly selected shoppers from several major shopping malls to gather information about their purchasing habits.
(b) The research study includes all registered members of a nationwide retail loyalty programme, covering every individual in the database.
(4 marks)
(7) The weekly working hours of employees in a small firm are summarized in the stem-andleaf diagram below.
3 | 5 8 9
4 | 0 2 4 6 8
5 | 1 3 3 7
6 | 0 2
(a) Determine the total number of employees.
(2 marks)
(b) What is the range of working hours?
(2 marks)
(c) What is the mode working hours?
(2 marks)
(d) If the minimum required working hours is 40 hours, calculate the percentage of employees below this threshold.
(3 marks)
(e) If a new employee working 30 hours is added, explain how the mean will be affected.
(3 marks)
Section B (50 marks)
GreenMove Mobility Pte Ltd specialises in shared electric mobility solutions, including electric scooters and bicycles, designed to support sustainable urban transportation. The company operates across multiple locations in the city, providing users with convenient access to shortdistance travel options through a mobile application that enables vehicle location, booking, unlocking, and payment.
In recent years, GreenMove has experienced rapid growth due to increasing environmental awareness and demand for alternative transport modes. Management recognises that user satisfaction and retention are critical to long-term success. In particular, the company seeks to better understand customers’ perceptions of key service dimensions such as application usability, vehicle availability, pricing transparency, safety, and responsiveness of customer support.
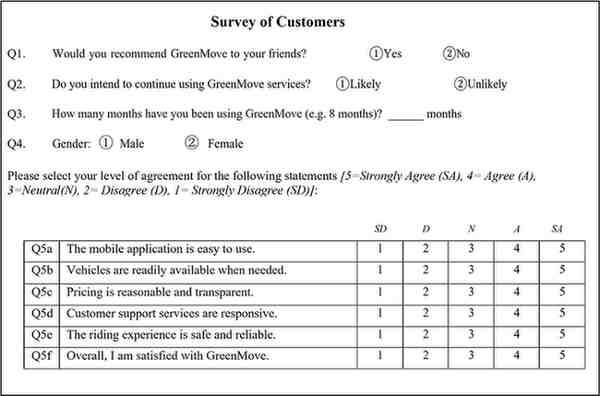
To support continuous improvement and data-driven decision-making, GreenMove conducted a User Experience Survey aimed at evaluating overall customer satisfaction and identifying areas for enhancement. A total of 50 users were randomly selected from the company’s registered user database and invited via email to participate in the survey. The use of random sampling helps ensure that the data collected is reasonably representative of the broader user population, thereby enabling meaningful statistical analysis.
The questionnaire used to collect the data is shown below:
Struggling with Your qts0109 business statistics individual assignment?
Native Singapore Writers Team
- 100% Plagiarism-Free Essay
- Highest Satisfaction Rate
- Free Revision
- On-Time Delivery