| University | Singapore Institute of Technology (SIT) |
| Subject | CVE2112 Data Analysis |
Project Description
This is an open-ended group assignment designed to give you hands-on experience in applying inferential statistics to real-world problems. You will work in a team of up to three students. Choose group members who are committed, communicative, and willing to contribute meaningfully to the
project.
The cornerstone of any statistical investigation is formulating meaningful questions and collecting relevant data. This project requires you to define your own topic of interest, source appropriate real-world data, and conduct a range of inferential statistical analyses.
You are encouraged to select a topic related to civil engineering disciplines, such as structural, geotechnical, construction, materials, hydraulics, hydrology, environmental, transportation, or project management. If you are unable to find a suitable civil engineering topic, other engineering domains are acceptable.
A successful project begins with a clear, testable hypothesis. Identify a specific question or claim you are curious about, and then determine how to collect and analyze data to explore that question. Vague or overly broad topics typically lead to weak analyses – be precise and focused.
Your project should follow the PPDAC framework (Problem – Plan – Data – Analysis – Conclusion). You may use statistical software such as Excel, RStudio, Python or others to perform your analysis. All output must be clearly labeled and interpreted in your own words
Learning Objectives
By completing this project, you will:
- Formulate precise statistical hypotheses relevant to real-world problems.
- Apply the PPDAC model to guide a complete statistical investigation.
- Use inferential statistical methods to evaluate and interpret real data.
- Critically assess the assumptions, limitations, and reliability of your conclusions.
- Develop teamwork, data literacy, and communication skills applicable in your future career.
Expect challenges – defining a good question, finding suitable data, making sound inferences – but these challenges are essential to deep learning. This project is intended to be intellectually rewarding, equipping you with statistical thinking that will benefit you beyond this course.
Important: You are not required to conduct original surveys or experiments. Use pre-existing datasets from reliable public sources such as government databases, research articles, online repositories, or academic theses. Ensure your data is credible, relevant to your hypothesis, and sufficient in size. Always cite your data sources clearly and include the full dataset as an appendix
to your report.
Hire a Professional Essay & Assignment Writer for completing your Academic Assessments
Native Singapore Writers Team
- 100% Plagiarism-Free Essay
- Highest Satisfaction Rate
- Free Revision
- On-Time Delivery
Project Scope
You will work with two datasets for this project:
1. Dataset 1 – Univariate Analysis
This dataset will be used for statistical analysis involving a single random variable
2. Dataset 2 – Bivariate Analysis (Simple Linear Regression)
This dataset involves two variables: one independent (predictor) and one dependent (response) variable. It may or may not be related to Dataset 1.
For Dataset 1, your main statistical tasks include:
- Descriptive statistics: Compute numerical summaries (mean, median, standard deviation, etc.) and create appropriate graphical representations (histograms, boxplots, etc.)
- Fitting theoretical probability distributions: Fit at least two candidate distributions to your univariate data (e.g., normal, exponential) and assess how well they represent the data
- Goodness-of-fit testing: Use a statistical test (e.g., Chi-square test) to evaluate how well your chosen distributions fit the observed data
- Confidence interval estimation: Construct 95% confidence intervals for population means
- Hypothesis testing: Perform statistical hypothesis tests for the population mean, including visual summaries of rejection regions, test statistics, and p-values
For Dataset 2, your linear regression analysis should not only evaluate the statistical association between the two variables but also critically examine whether a causal relationship is plausible. This includes:
- Creating a scatter plot with a fitted regression line, including the equation and coefficient of determination (R²)
- Constructing confidence and prediction intervals for the regression line
- Performing residual analysis (residual plots and normal probability plot) to evaluate assumptions
- Providing 95% confidence intervals for both the slope and intercept
- Interpreting the regression results in context:
o Does the relationship make practical sense?
o Could there be confounding variables or reverse causality?
o Is the predictor variable something that could reasonably cause a change in the response variable?
Students are expected to distinguish between correlation and causation and discuss their findings with a critical mindset, acknowledging the limitations of the data and analysis.
Final Report Requirements
The final submission should read like a concise technical paper or article – clear, logical, and reader – friendly. Use narrative style and avoid raw software output dumps without interpretation. The report should include the following sections:
1. Title
A clear and informative title for your study
Buy Custom Answer of This Assessment & Raise Your Grades
2. Introduction
- Brief background and motivation
- Statement of the main question, claim, or hypothesis
3. Data Collection
- Description of the datasets
- Source of the data, collection date, and any potential limitations or biases
- Context of the dataset (who, what, where, when, why, how)
4. Univariate Analysis
- Descriptive statistics: Mean, median, standard deviation, etc.
- Data visualization: Histograms, boxplots, etc
- Fitting a theoretical distribution: e.g., normal, exponential (at least two fits are required)
- Goodness-of-fit test (e.g., Chi-square)
- Confidence interval for the population mean (95% level)
- Hypothesis test for the mean (clearly state null and alternative hypotheses)
- A visual summary of the test: rejection regions, test statistic, and p-value
5. Bivariate Analysis (Simple Linear Regression)
- Scatter plot with fitted regression line
- Equation of the line and coefficient of determination (R²)
- Confidence and prediction intervals for the regression line
- Residual analysis: residual plots and normal probability plot
- 95% confidence intervals for slope and intercept
6. Conclusion and Discussion
- Interpretation of the results in the context of the original hypothesis
- Reflection on limitations, assumptions, and reliability of conclusions
- Suggestions for further investigation or practical implications
7. Appendix
Raw data tables with sources
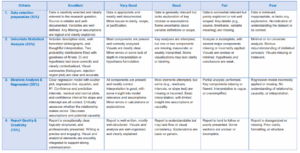
Annex A – Assessment Rubric
Stuck with a lot of homework assignments and feeling stressed ? Take professional academic assistance & Get 100% Plagiarism free papers
Hire Singapore Assignment Writers for SIT Cheap Assignment Help Services at the cheapest price. Score A+ grades with the help of our valuable online assignment writing services in Singapore.

Looking for Plagiarism free Answers for your college/ university Assignments.
- CVEN3501 Water Resources Engineering Coursework Brief 2026 | UNSW
- MKTG101 Marketing Coursework Brief 2026 | Singapore Management University
- NCO102 Effective Writing Tutor-Marked Assignment 1, 2026 | SUSS
- SC1101E Making Sense of Society Written Assignment 1 Brief 2026 | NUS
- BUSM2653 People Analytics Assesment 1 Insightful Analytics Report 2026 | SIM
- MLA604 Maritime Operations Assessment Brief 2026 | MLA College
- ICT226 Enterprise Systems and Integrated Business Process End-of-Course Assessment 2026 |
- OMGT2229 Strategic Supply Chain Assignment 3, 2026 | RMIT University
- NCO103 Listen and Be Heard: Effective Communication through Storytelling TMA 02, 2026 | SUSS
- PSY259 Personality and Individual Differences End-of-Course Assessment 2026 | SUSS